
Ahead of you lies a vast and complex world of trading. With every news cycle fortunes are being built and sectors are crumbling, but you know that there savvy traders who making money on both ends of the deal. It is no secret that different strategies, techniques, and methods can be used to make a fortune in the markets. But among them all, one pattern is particularly notorious: the head and shoulders pattern. What is it? How do you spot it? And most importantly, what should you do when you see it unfold? We’ll answer all of these questions (and more) in this comprehensive guide to the head and shoulders pattern for trading so that you can start to get your little piece of the action, too!
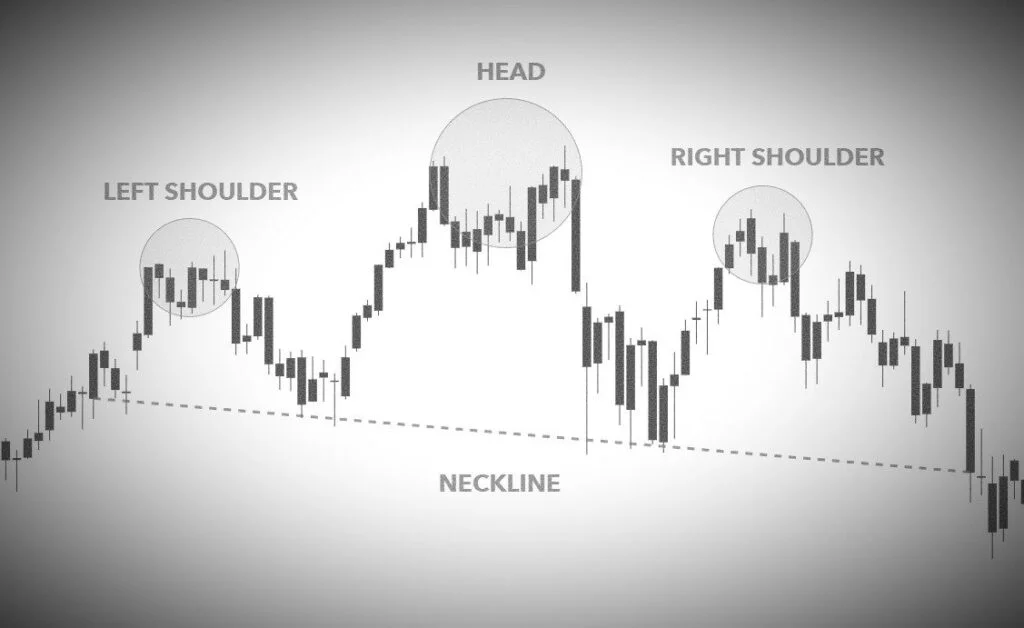
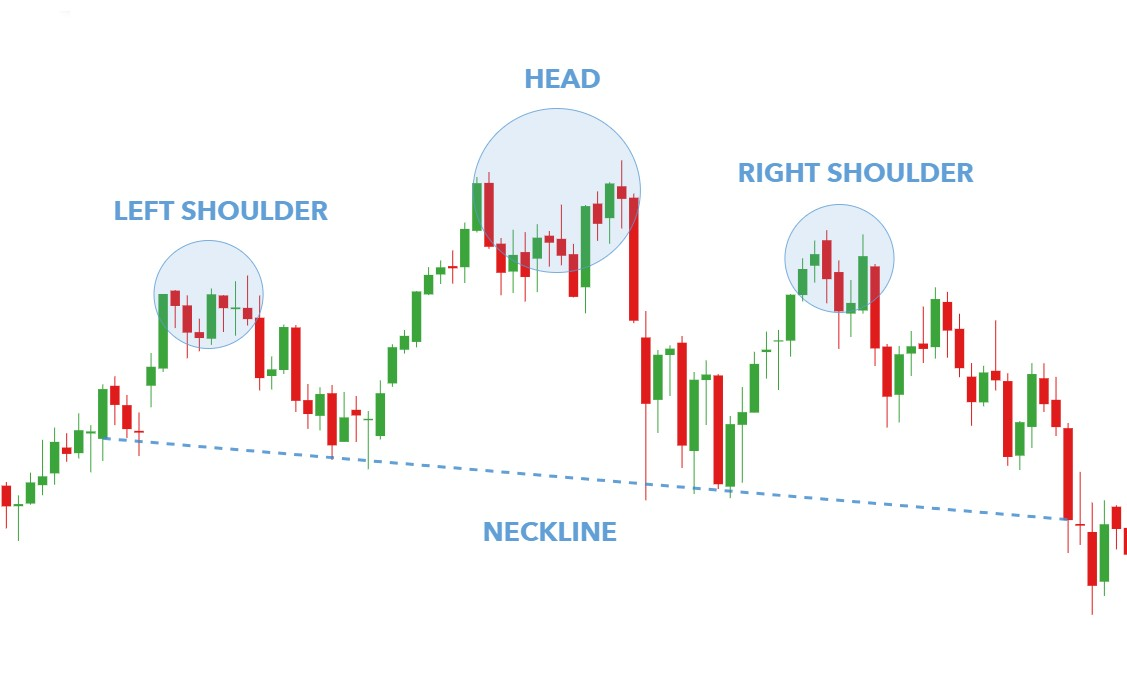
The head and shoulders trading pattern is a great tool for traders of all experience levels. It can be used to enter into a trade, identify potential support and resistance levels, and identify potential trend reversal lines. It is a popular technical analysis tool that traders can use to identify potential reversal patterns in the market. The pattern is made up of three successive peaks, with the middle peak being the tallest and the first and third peaks being equal in height or lower. The neckline of the pattern is drawn horizontally across the lows between the two troughs that make up the left and right shoulders. When prices break below the neckline, it signals that a downtrend may be underway. Conversely, a breakout point price rise above the neckline suggests that an uptrend could be developing. Trading using this pattern can be profitable if used correctly, but it’s important to remember that not all head and shoulder patterns will lead to a reversal in price rises.
- What happens when we see the head and shoulders pattern?
- How do you spot the head and shoulders pattern?
- What are the advantages of the head and shoulders pattern?
- What is a reversal in the market and why is it profitable?
- When is the best time to “move” with the head and shoulders pattern?
- 3 things that traders should be aware of when trading the head and shoulders pattern
- How do I trade the head and shoulders chart pattern?
- What are some common mistakes people make when trading the head and shoulders pattern?
- Can the head and shoulders pattern be used with AI trading strategies?
- Can you use the head and shoulders technique with algo trading?
- Is the H&S pattern good with quant trading?
- Can I use the head and shoulders pattern for day trading?
- What is the neckline?
- Is a head and shoulders pattern bullish or bearish?
- What is the difference between a head and shoulders pattern and a double top?
- Do head and shoulders patterns apply to sustainable stock trading strategies?
- What is the history of technical analysis of the markets?
- How can I learn more about technical analysis?
- What is the difference between technical analysis and fundamental analysis?
- The Bottom Line on inverse head and the head and shoulders formation
What happens when we see the head and shoulders pattern?
The head and shoulders trading pattern is formed when there is a sell-off in the market followed by a period of consolidation. The first peak in the pattern (the left shoulder) is created when prices make a new high, but then quickly fall back down. This high is then followed by a second peak (the head), which is typically higher than the first peak. After the head is formed, prices once again pull back and consolidate. This forms the right shoulder, which is typically lower than the head. Finally, prices break below the neckline and continue to fall.
The key to trading this pattern successfully is to wait for price moves to break below the neckline before taking any short positions. It’s also important to note that the head and shoulders trade pattern is not always reliable, so make sure to confirm any potential reversal patterns with other technical indicators before taking a trade.
Savvy Investors are also reading…
The Best Sites to Learn How the Markets Work
The Best Artificial Intelligence Investing Sites
The Best Supported Algorithm or Quant Trading Sites
How do you spot the head and shoulders pattern?
The head and shoulders trade pattern can be spotted on any time frame, but it’s most commonly seen on daily charts. To spot the pattern, you’ll need to look for three successive peaks with the middle peak being the tallest. The neckline is drawn horizontally across the lows between the two troughs that make up the left and right shoulders. When price moves break below the neckline, it signals that a downtrend may be underway.
What are the advantages of the head and shoulders pattern?
The head and shoulders trades pattern is a very popular chart pattern that is used by traders to predict potential reversals in the markets. The pattern is created when there is a peak followed by two lower highs, and then another higher high. This creates a “head and shoulders” shape on the chart.
What is a reversal in the market and why is it profitable?
A reversal is a change in the direction of the markets. So, if the market is going up and then it changes direction and starts to go down, that is a reversal. A market reversal can be profitable for traders because they can trade in the opposite direction of the original move and profit from the price break difference. The head and shoulders pattern is used by traders to predict potential reversals.
When is the best time to “move” with the head and shoulders pattern?
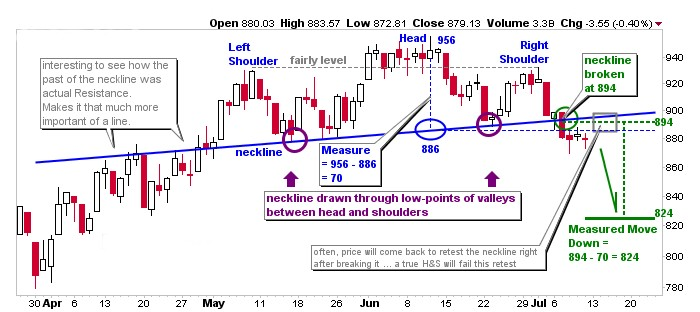
The best time to “move” with the head and shoulders pattern is when the market breaks below the neckline. The neckline is created by connecting the lows of the two shoulders. When the market breaks below this line, it is a signal that the reversal is confirmed and the market is likely to continue going down.
3 things that traders should be aware of when trading the head and shoulders pattern
There are a few things that traders should be aware of when trading the head and shoulders trading pattern.
- First, the pattern is not always accurate and can sometimes lead to false signals.
- Second, the neckline is not always perfectly horizontal and can sometimes be angled up or down. This can make it difficult to identify the neckline and can lead to false signals.
- Finally, the head and shoulders trading pattern is a reversal pattern and therefore it is only accurate in predicting market reversals. It cannot predict the direction or magnitude of the move.
How do I trade the head and shoulders chart pattern?
The best way to trade the H&S pattern is to wait for the neckline to be broken. When the neckline is broken, it is often an indication that the market is about to reverse. For traders, the neckline can be a helpful tool in trading stocks.
What are some common mistakes people make when trading the head and shoulders pattern?
One of the most common mistakes people make when trading the head and shoulders pattern is trading it too early. The best way to trade the head and shoulders pattern is to wait for the neckline to be broken. When the neckline is broken, it is often an indication that the market is about to reverse. For traders, the neckline can be a helpful tool in trading strategies.
Another common mistake people make when trading the H&S pattern is not waiting for confirmation. This is indicated by the right shoulder not being as high as the left shoulder. This can be a sign that the market is not ready to reverse and may continue going down.
The last common mistake people make when trading the H&S pattern is not managing their risk. When trading any pattern, it is important to manage your risk by using stop losses and take profit levels. This will help you to protect your capital and avoid large losses.

Can the head and shoulders pattern be used with AI trading strategies?
Absolutely. First of all, the head and shoulders chart pattern is a great way to enter into a trade. Oftentimes, the market will make a small move before making a larger move in the same direction. This is known as a “head fake.” The head and shoulders pattern can help you stay in a trade during these dangerous periods. AI trading strategies can take advantage of all of these features to place better trades and make more money.
In addition, many AI trading strategies use support and resistance levels to place their trades. The H&S is a great way to identify potential support and resistance levels. This is because the pattern creates three distinct points: the left shoulder, the head, and the right shoulder. Each of these points can be used as a support or resistance level.
Finally, many AI trading strategies use upward trend lines to place their trades. The head and shoulders pattern can be used to identify potential trend lines. This is because the pattern creates two potential trend lines: the neckline and the shoulder line. These trend lines can be used to place trades or set stop losses.
Can you use the head and shoulders technique with algo trading?
Yes. When using algorithms for trading, you can take advantage of the H&S pattern to time your trades better. This is because the pattern can help you identify potential support and resistance levels, as well as potential trend lines. You can use these levels and lines to place better trades and make more money.
Is the H&S pattern good with quant trading?
The head and shoulders pattern can be used with quantitative trading strategies. This is because the pattern can be used to identify potential reversals in the market. When the pattern is identified, traders can use this information to enter or exit trades. For quants, the H&S pattern can be a helpful tool in trading strategies.
Can I use the head and shoulders pattern for day trading?
Yes. The head and shoulders pattern can be used for day trading. This is because the pattern can be used to identify potential reversals in the market. When the pattern is identified, traders can use this information to enter or exit trades. For day traders, the H&S trade pattern can be a helpful tool in trading strategies.
What is the neckline?
The neckline is the line that connects the lows of the left shoulder and the head. The neckline can be used to identify potential reversals in the market. When the neckline is broken, it is often an indication that the market is about to reverse. For traders, the neckline can be a helpful tool in trading strategies.

Is a head and shoulders pattern bullish or bearish?
The H&S trading pattern is bullish. This is because the pattern typically forms during an uptrend and signals a potential reversal. When the pattern is identified, traders can use this information to enter or exit trades.
What is the difference between a head and shoulders pattern and a double top?
The main difference between a head and shoulders chart pattern and a double top is that a head and shoulders pattern has a neckline. The neckline is the line that connects the lows of the left shoulder and the head. The neckline can be used to identify potential reversals in the market. When the neckline is broken, it is often an indication that the market is about to reverse. For traders, the neckline can be a helpful tool in trading strategies. Double tops do not have a neckline and are not as effective at identifying potential reversals.
Do head and shoulders patterns apply to sustainable stock trading strategies?
When it comes to trading ESG or sustainable stocks, the H&S pattern can still be applied. This is because the pattern can be used to identify potential reversals in the market. When the pattern is identified, traders can use this information to enter or exit trades. For sustainable stock traders, the head and shoulders pattern can be a helpful tool in trading strategies.
For example, if a stock is moving up and forms a head and shoulders pattern, it may be time to exit the trade. This is because the pattern signals a potential reversal. However, if the stock breaks out of the pattern to the upside, it may be a good time to enter a long position. When it comes to making sustainable investments, the H&S pattern can still be a helpful tool.
What is the history of technical analysis of the markets?
The technical analysis of prices dates back to the early 1800s. In 1833, Charles Dow, the founder of The Wall Street Journal, developed what is now known as Dow Theory. This theory states that the market prices move in cycles and that these cycles can be used to predict future market movements. Technical analysis has since evolved and become a widely used tool by traders and investors.
At around the same time, in Edo Japan, a form of technical analysis was developed to trade rice. This system, known as candlestick charting, is still used today by traders around the world. And keep in mind that historical data analysis was successful without the aid of computers! Just think of what you could do with a modern-day computer and the power of technology at your fingertips.
How can I learn more about technical analysis?
There are many ways to learn about technical analysis. One way is to read books and articles. But there is no greater teacher than experience, and there are many supported trading courses and tutorials available online through many of the best investing software tools.
What is the difference between technical analysis and fundamental analysis?
Technical analysis is a method of analyzing prices that focuses on price data and charts. Fundamental analysis is a method of analyzing prices that focuses on economic data. Technical analysis is often used by traders to make short-term predictions or a short trade in market movements. Fundamental analysis is often used by investors to make long-term predictions about market movements.
Technical analysis is a relatively new field, while fundamental analysis has a long history. Fundamental analysis is more common among investors, while technical analysis is more common among traders. Technical analysis is often considered to be more speculative.
Learn to Make Money with Copy-Trading
Learn about The Ins and Outs of Algorithmic Trading
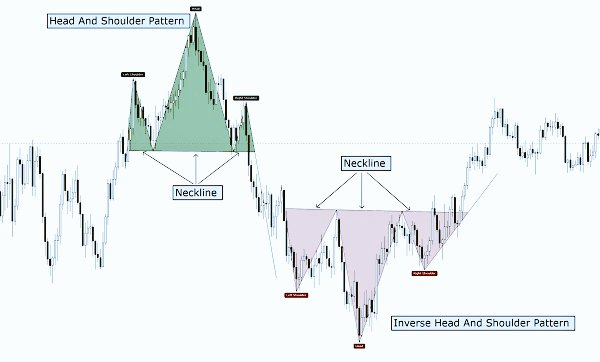
The Bottom Line on inverse head and the head and shoulders formation
The H&S is a technical analysis tool that traders can use to identify potential reversals in the market. The pattern is formed by a left shoulder, head, and right shoulder. When the price reaches the neckline after forming the right shoulder, it is often considered an indicator that the upward trend has ended and a reversal may be imminent. Many online trading platforms offer free tutorials on how to spot this pattern and take advantage of potential opportunities in the market. By understanding what to look for, you too can start trading tight spreads using this powerful technique. Have you tried using the head and shoulder pattern in your own trades or when trading forex? Let us know how y
What are CFD stocks and how can you trade them?
What are Swing Trading Strategies?

Dean Emerick is a curator on sustainability issues with ESG The Report, an online resource for SMEs and Investment professionals focusing on ESG principles. Their primary goal is to help middle-market companies automate Impact Reporting with ESG Software. Leveraging the power of AI, machine learning, and AWS to transition to a sustainable business model. Serving clients in the United States, Canada, UK, Europe, and the global community. If you want to get started, don’t forget to Get the Checklist! ✅